The epsilon-net is one of the most vital components of the proof. It is important to understand how the netting procedure works, and to ensure that it is functioning correctly.
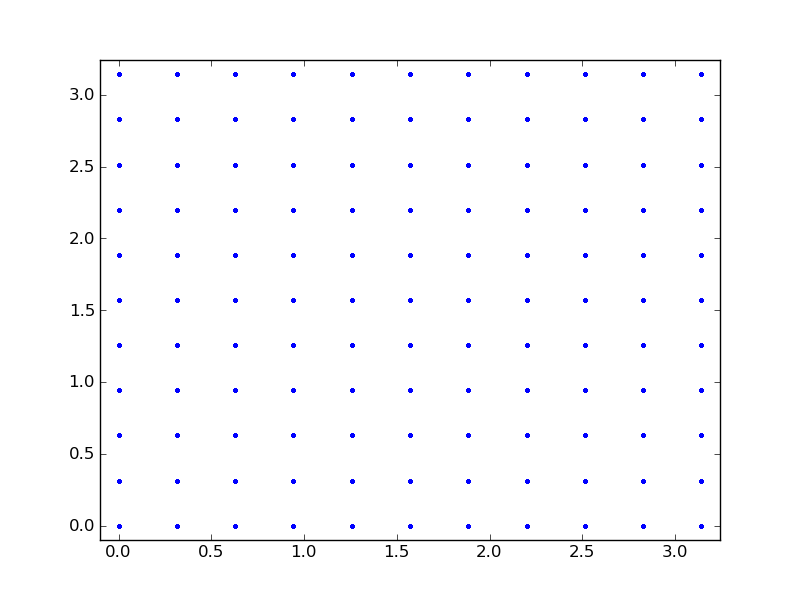
The epsilon net itself is formed by a discretization of the cube [0,π]3. We place an evenly spaced grid of points in this space which we take to be the centers of cubes within which we perform our analysis, as shown in Figure 1.
Figure 1: a 11 x 11 x 11 grid with grid spacing π/10 projected on to the x-y plane.
We refine the epsilon net in the following manner. The cubic lattice Z3 ∩ [-5,5] is generated at the beginning of the program. This lattice (called ``the_chunk'' in the code) is used to perform the refinement. To refine around a point x0, we translate the vectors in the lattice so that the lattice is centered at x0 , and then rescale all of the resultant vectors so that the lattice has the appropriate spacing between grid points. Figure 2 and Figure 3 below show an epsilon net before and after refinement.
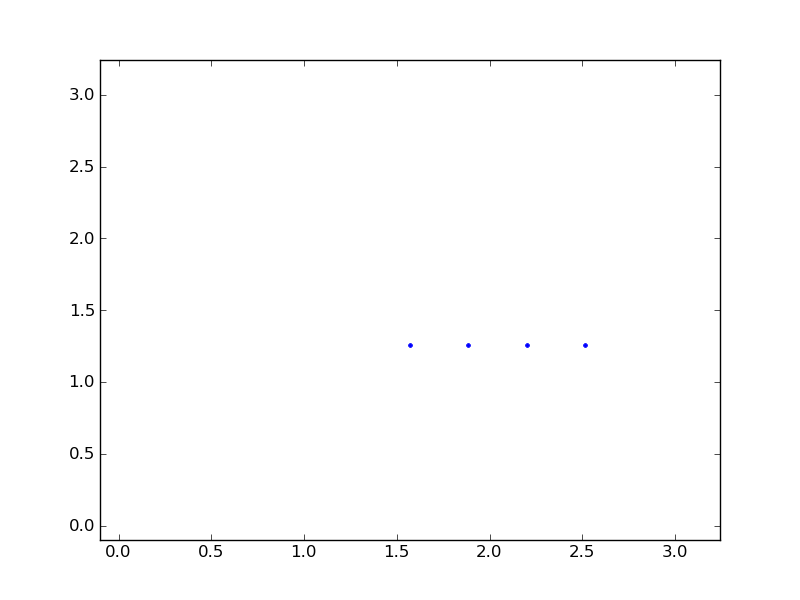
Figure 2: The projection of the subset of points from Figure 1 to be refined on to the x-y plane.
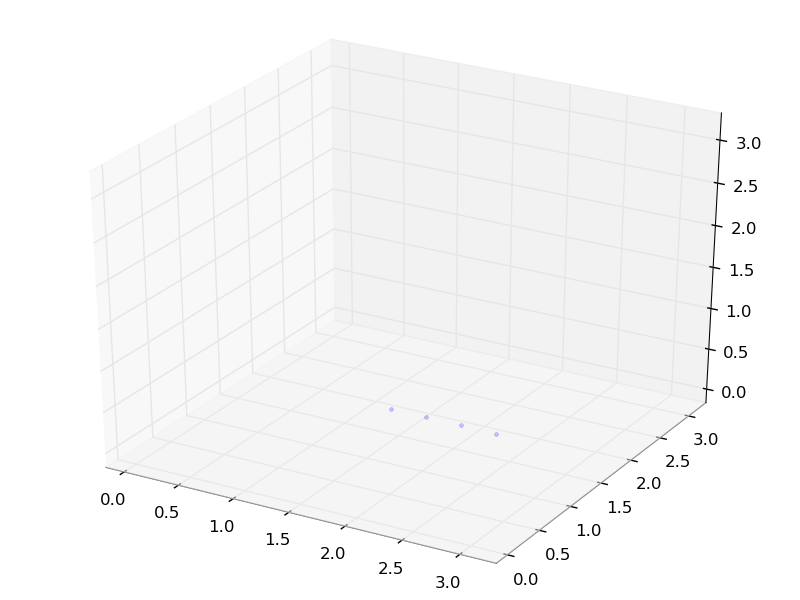
Figure 3: The subset of points from Figure 1 to be refined.
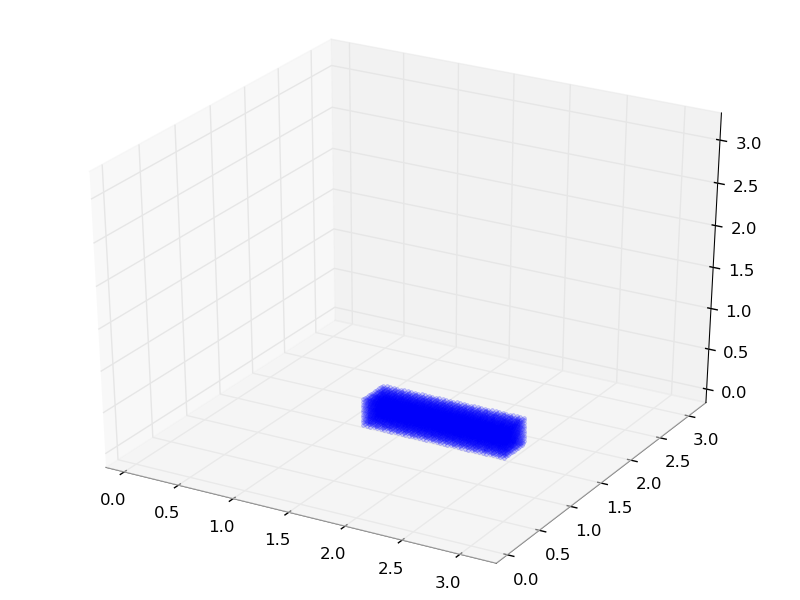
Figure 4: A tenfold refinement of the grid around the points from Figures 2 and 3.
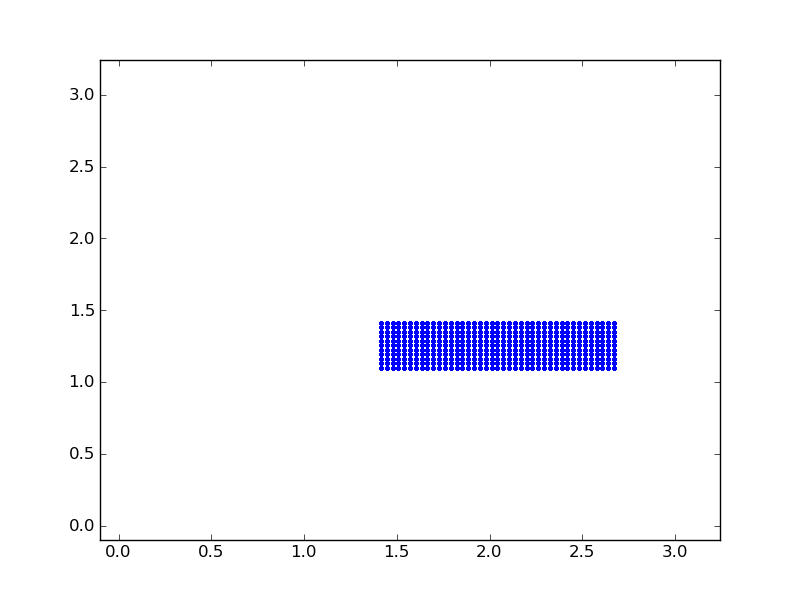
Figure 5: A tenfold refinement of the grid around the points from Figures 2 and 3. (x-y projection)
To demonstrate that the code is performing these procedures correctly, the ``test_suite'' for the code generates a net and refines a subset of it. The test initially generates an 11 x 11 x 11 grid and stores this in a file which is placed in the directory in which the program is being run (Figure 1). This new file is then read, and turned back into a net. A small portion of this net is selected to be refined (Figures 2-3). This portion of the net is then written to disk. Finally, this portion of the net is refined and this refined net is written to disk (Figure 4-5). We have provided a python script to visualize these refinement steps. Just run it after the ``test_suite'' has completed in the same directory to generate images corresponding to the projections of the resultant grids on to coordinate planes. For examples of the images one should expect, see Figures 2- 5.